
WATER QUALITY REPORTS & DATA
Monitoring Water Quality to Protect Public Health.
Since 1995, our River Science Program has formed the backbone of our work.
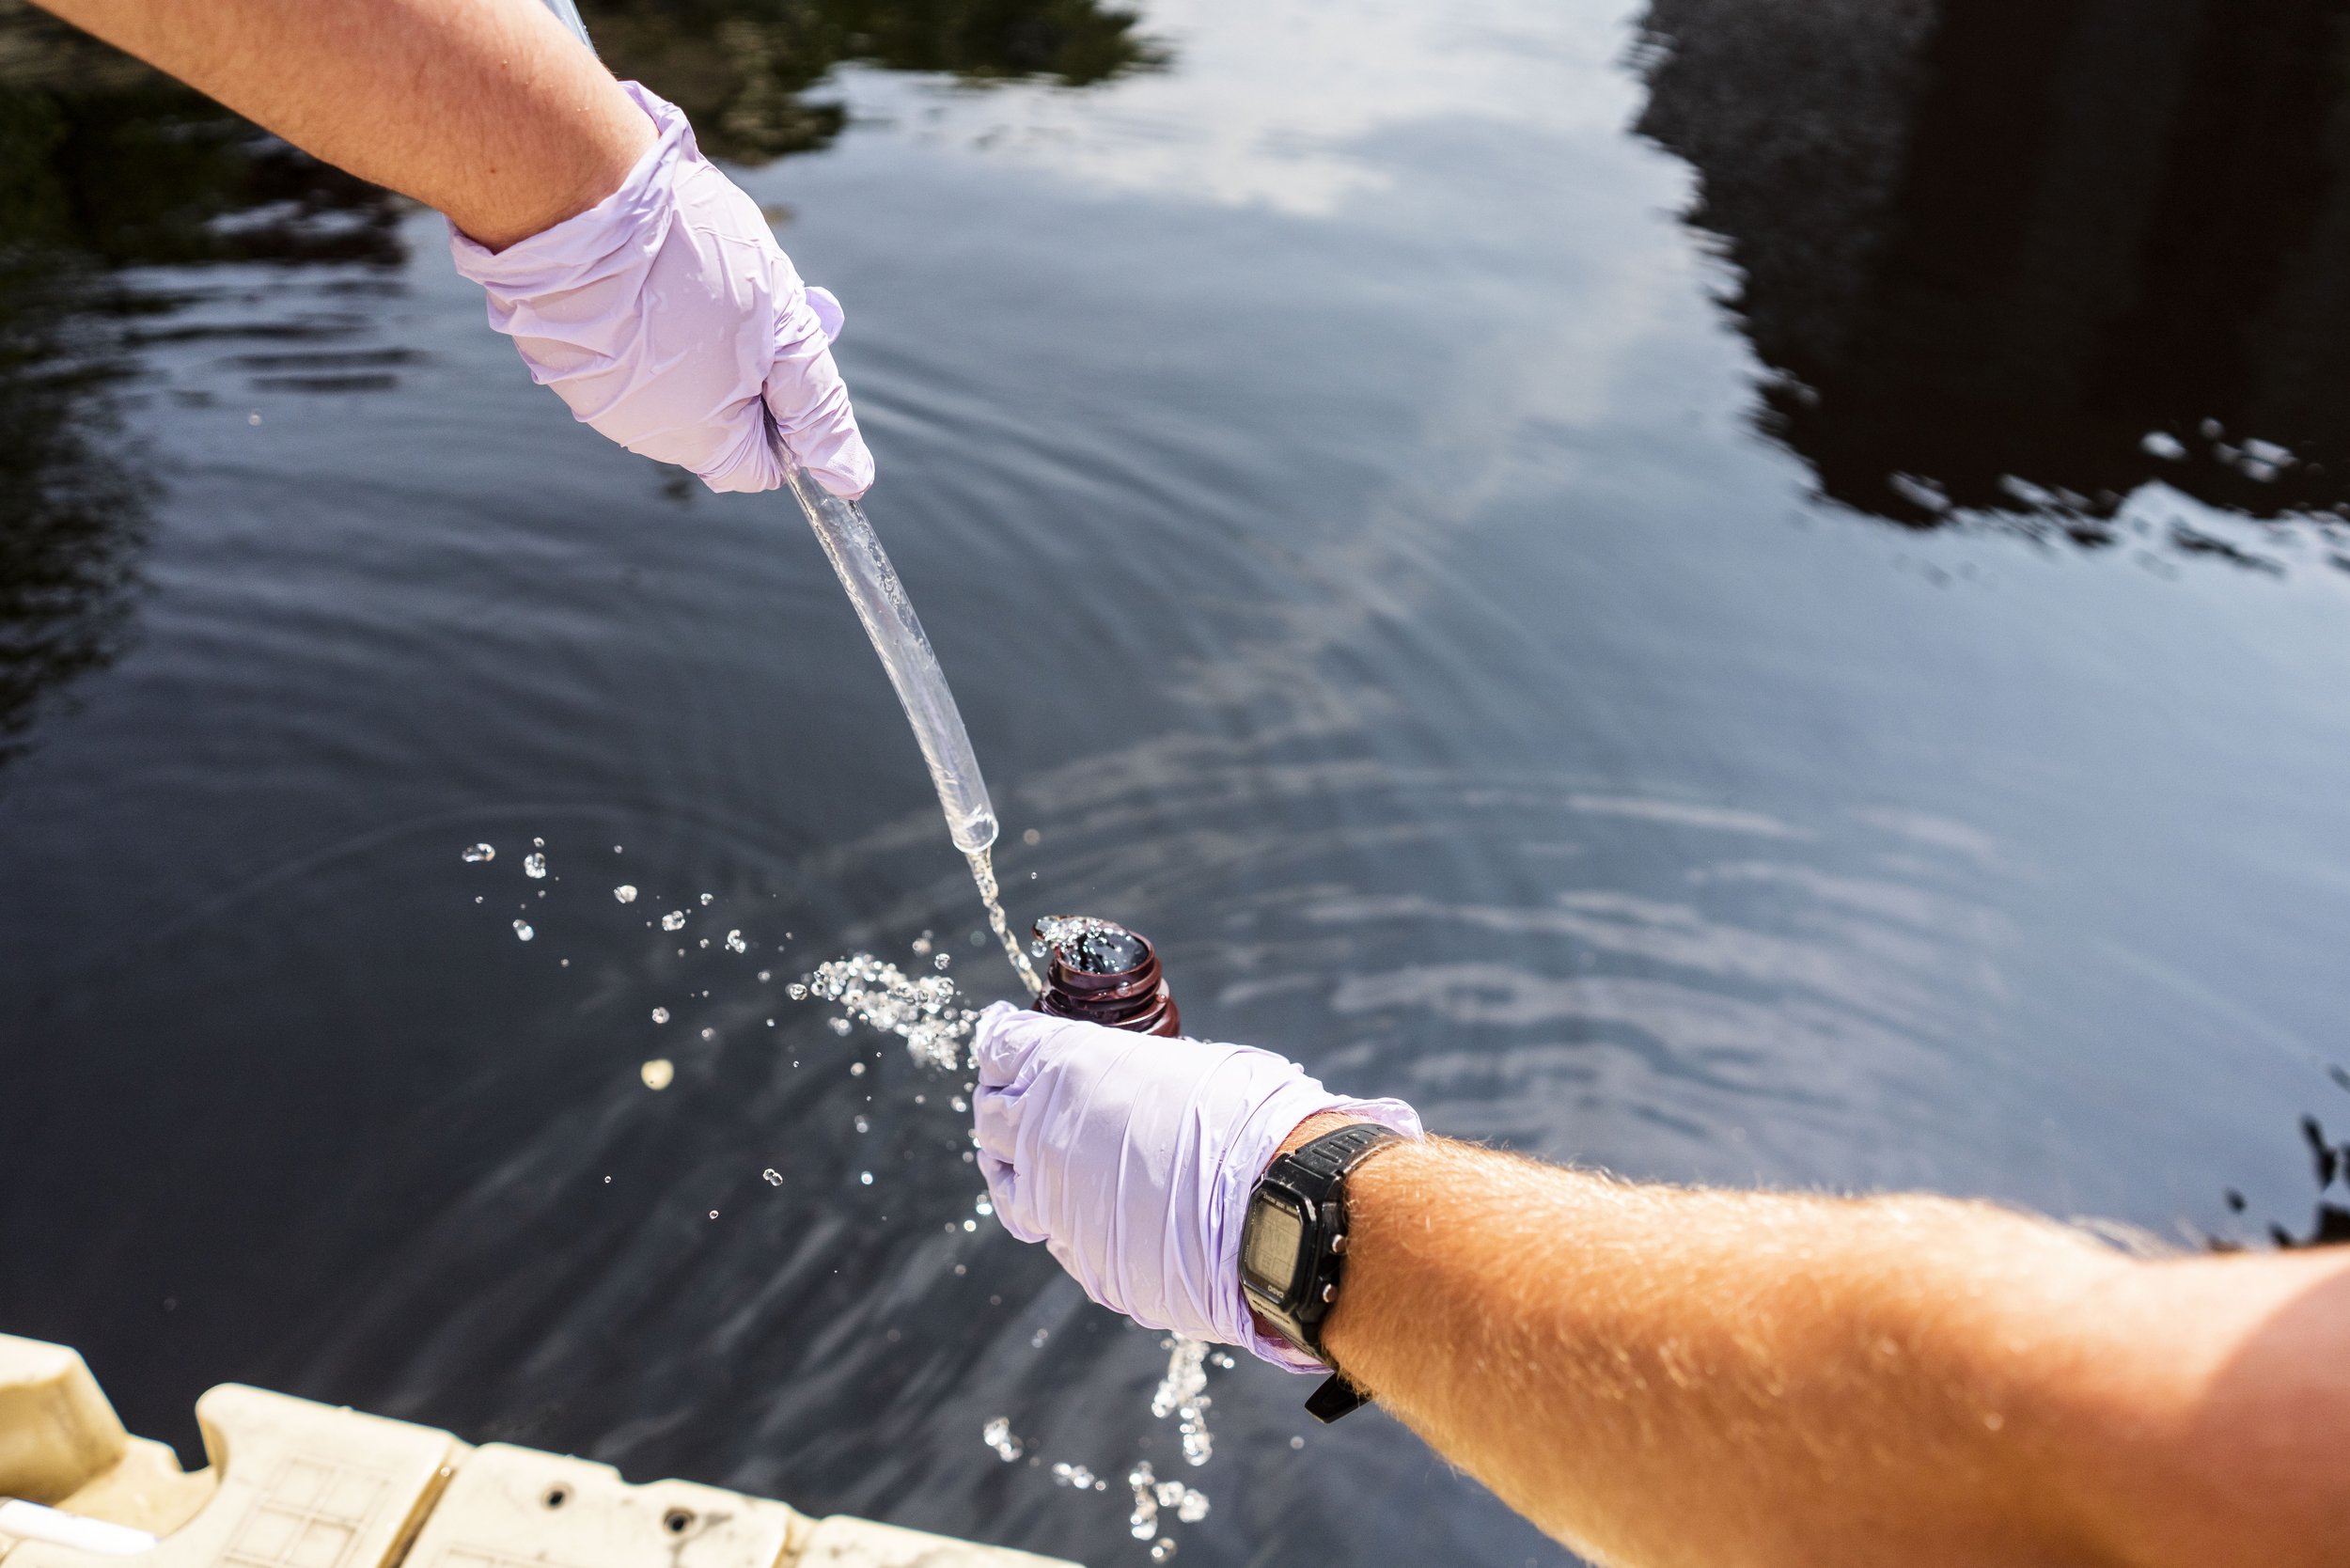
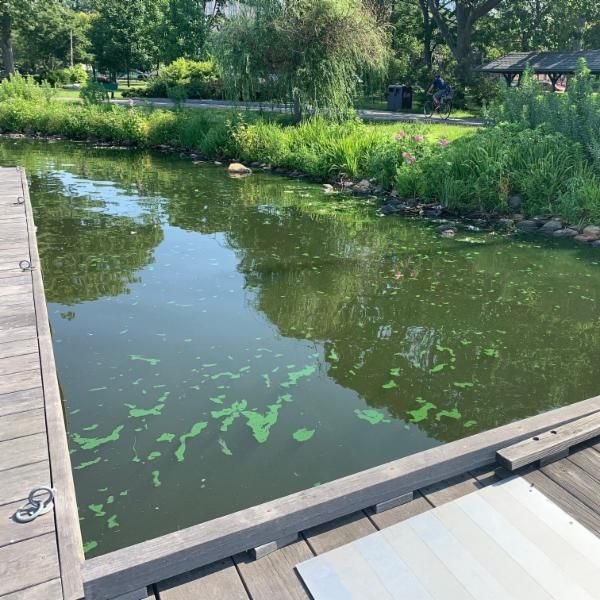
Each year, we bring together hundreds of dedicated community science volunteers to closely monitor water chemistry, track pollution, identify cyanobacteria blooms, assess streamflow, and identify challenges for the Charles River ecosystem.
The data we collect is vital– CRWA maintains one of the most robust water quality data sets in the nation and both the Environmental Protection Agency (EPA) and Massachusetts Department of Environmental Protection (MA DEP) rely on our sampling results to set and enforce water quality standards.
Charles River Report Card
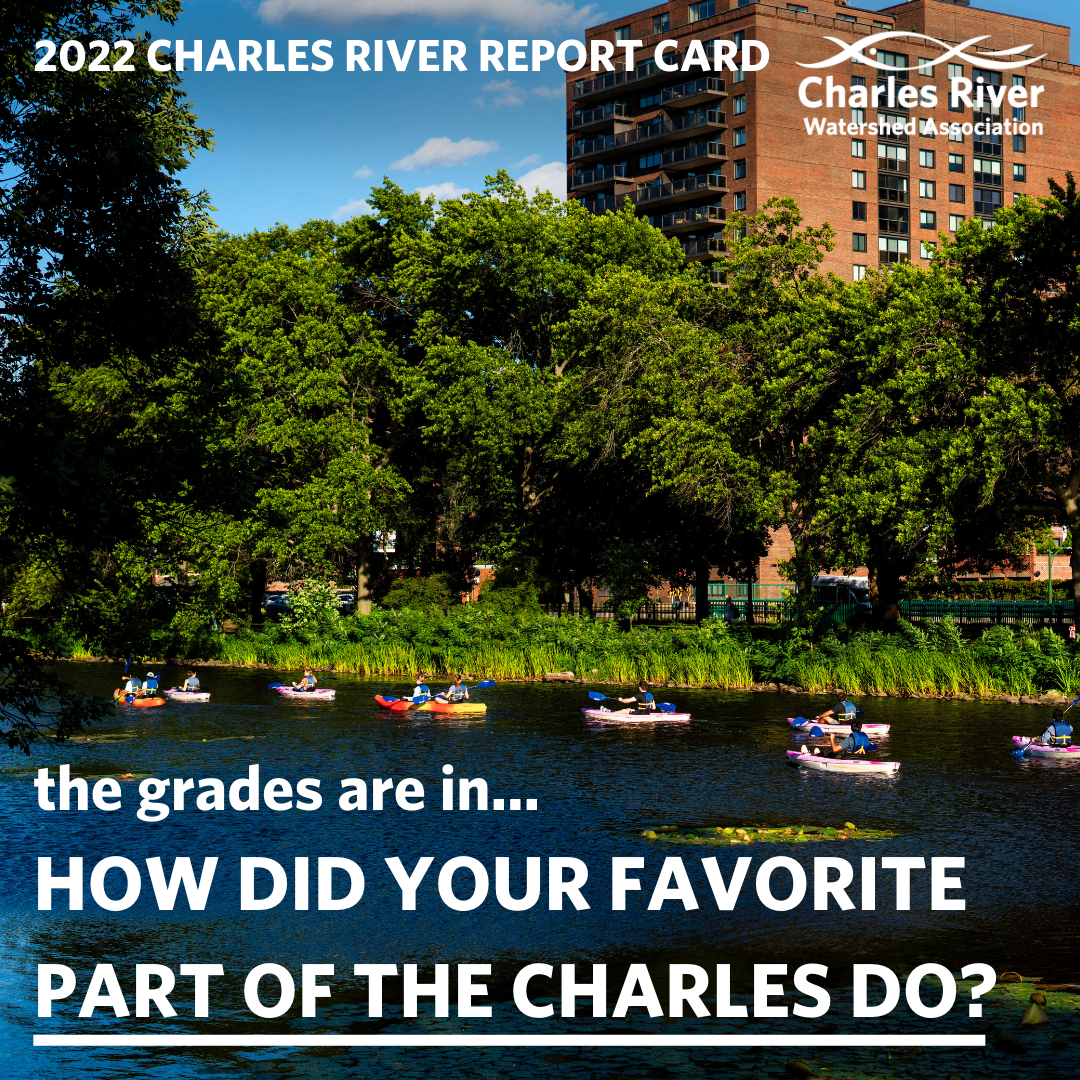
Since 1995, U.S. EPA has issued the Charles River Report Card to track the recreational health of the river and educate the public on continued challenges to water quality.
Based on our data collected by community science volunteers, the report card grades represent the percentage of time E. Coli bacteria, Combined Sewer Overflows (CSOs), and cyanobacteria blooms impede safe recreation for four segments of the main stem and two tributaries, the Stop River and Muddy River.
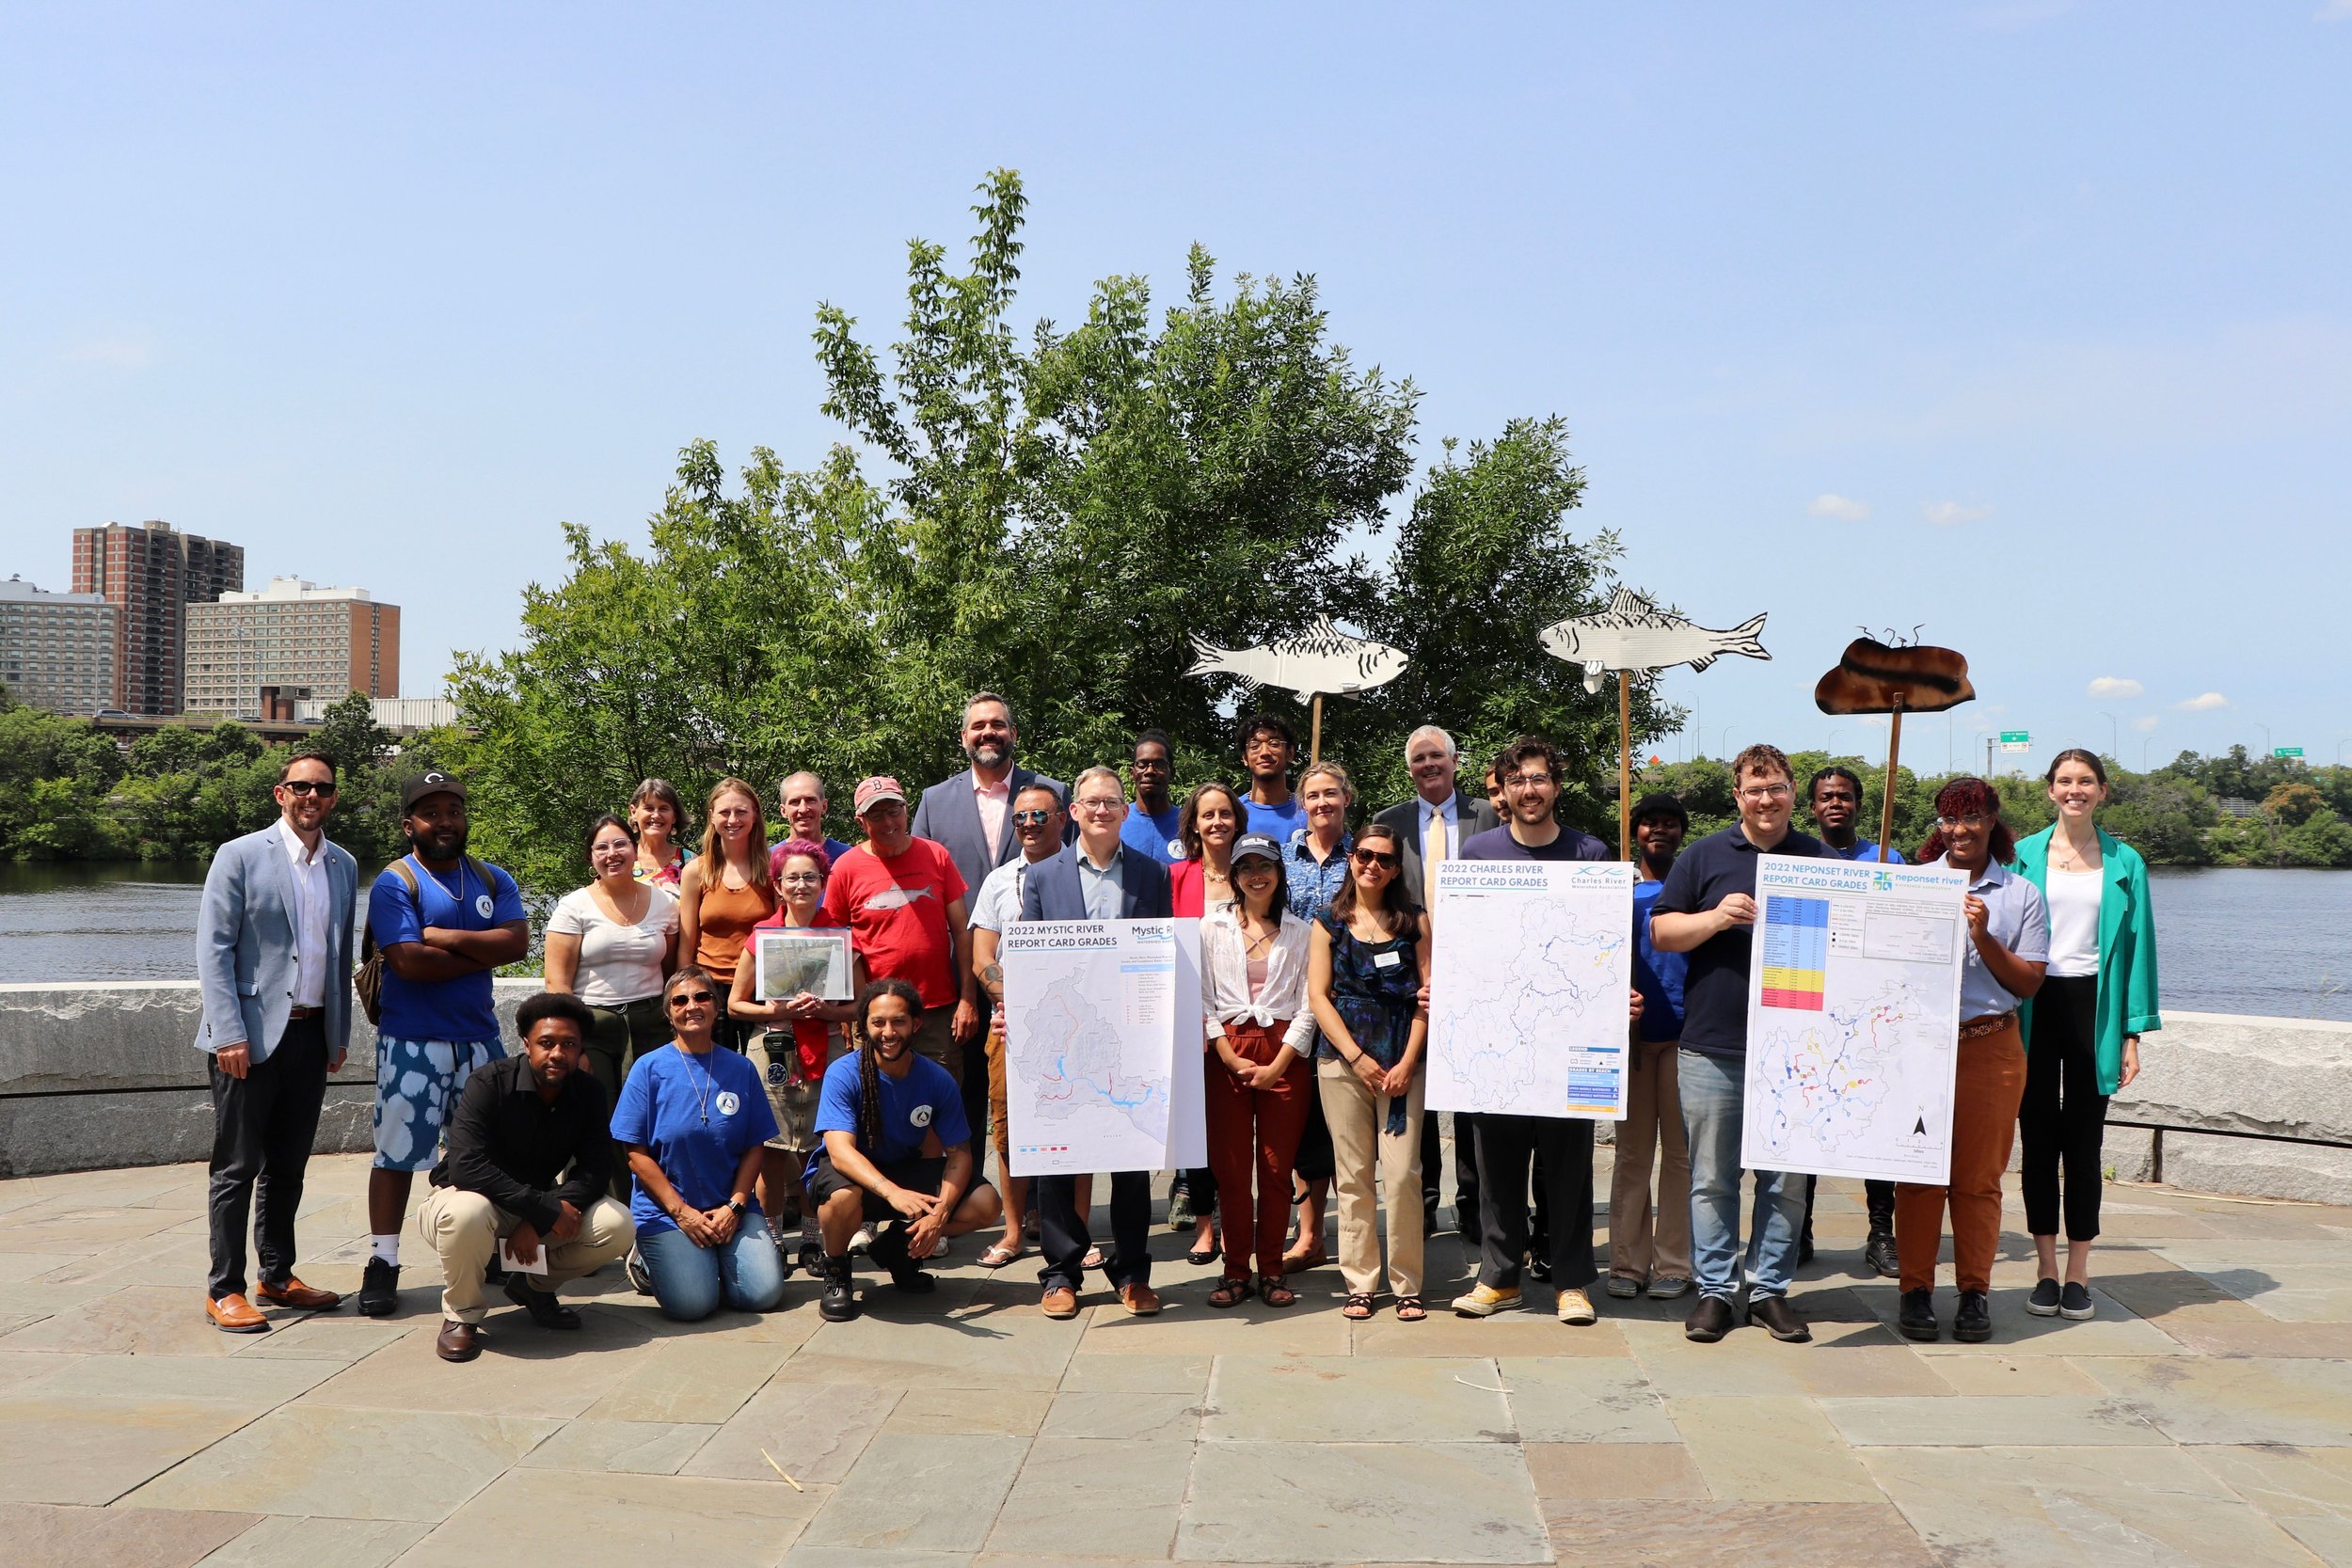
Now issued along with the Mystic and Neponset Rivers, the 2025 Three Rivers Report Card, with grades ranging from A to C, shows vast improvements in the health of the Charles since decades past, yet how stormwater pollution, sewer overflows, and climate change threaten progress towards a swimmable river for all.
Annual Water Quality Report
Each year, our science team analyzes and interprets data collected in our four core sampling programs; Volunteer Monthly Monitors, Flagging Program, Cyanobacteria Monitoring, and Biological Monitoring, to understand trends in water quality and assess ecosystem health.
Our steadfast commitment to closely monitoring water quality to track trends in the Charles River is as important as ever, and it allows us to utilize the findings of our Annual Water Quality Report to advocate for solutions to restore the river ecosystem and build climate resilience.
Thank you to the Bilezikian Family Foundation, Clif Family Foundation and Roy A. Hunt Foundation for supporting this critical work.
Explore Our Data:
The E. Coli Dashboard, developed with Code for Boston, brings data to life. Each month, over 80 community scientist volunteers gather at 35 sites along the main stem of the Charles River and two tributaries, the Muddy River and Stop River, to collect water samples, measure temperature and depth, and record river conditions. This dataset, which goes back to 1995, is helpful for identifying long-term trends and studying the impact of stormwater pollution and sewage overflows on the river ecosystem.
-
DEFAULT VIEW
The dashboard shows the E. Coli concentration of all samples taken since 2005, for all the sites visible on the map.
Click the home button on the map to return to the default zoom view.
SELECT TIME PERIOD
You can select a different time period using the selector on the top right of the dashboard.
When the map is zoomed out, sampling sites are shown as clustered together. The size of the circle shows how many samples sites are in a cluster.
EXPLORE SAMPLING SITES
To explore sampling sites, click on a site in the map, and a pop-up will show the site name and recent data taken there.
SELECT SAMPLING SITES
To select sampling sites, there are two options:
Using the map: Click the arrow icon on the top left of the map; it should turn blue. Then, click on any site on the map, or hold the shift key to select multiple.
Using the sample site list (directly underneath the map): Click on the site you are interested in, and click that site again to deselect it.
-
The donut chart shows the percentage of sites that fall into each health-risk level, for the time period and site(s) selected. If you select one site, it will show the distribution of health-risk levels at that site, over the time period selected.
The gauge chart shows the average E. Coli concentration of the selected site(s), over the time period selected.
The line chart shows all the data at the select site(s) over time, and which level of health risk they fall into. You can use the slider above the graph to change the time period visible, and watch the graph change!
-
The US Environmental Protection Agency (EPA) & the Massachusetts Department of Environmental Protection (MassDEP) sets water quality standards for E. coli bacteria to indicate the level of health risk in freshwater.
MassDEP recommends not swimming or fishing when the level of bacteria exceeds 235 colony forming units (cfu) per 100 mL and not boating on days when the level of bacteria exceeds 1260 cfu/100 mL. This so-called “single-sample threshold” is used everywhere in the dashboard.
BLUE (Safe for swimming): E.Coli concentration is under or equal to 235 cfu/100 mL
YELLOW (Safe for boating only): E.Coli concentration is between 236 cfu/100 mL and 1260 cfu/100 mL
RED (Not safe for activities): E.Coli concentration is above 1260 cfu/100 mL
-
Recent News.








We can’t do this without you.
We are the only organization that maintains a comprehensive, year-round sampling program spanning the full extent of the Charles River, and it’s only possible with the generous support of donors like you. Help us continue to use sound science to identify challenges and determine solutions to guide us to a cleaner, healthier Charles River for future generations.